
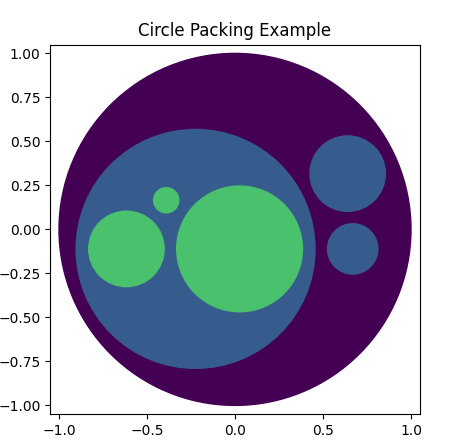
Generated with npcirclepack, matplotlib.
D3.js provides (amongst many other things) useful tools for visualizing hierarchical data. One way to visualize such data is with a circle packing algorithm. See a simple interactive demo below.
D3 circle pack is great for interactive graphics with a reasonable amount of data. However, recently I was visualizing an unreasonable amount of data, and the circle packing was starting to take too long. That's not to say D3 circle pack is slow (it can handle 100k circles in just about 7s), but that's a long time in the frontend. Additionally, there was a lot of extra time and memory moving the results into a format I could use quickly.
Instead I ported the code to Python so I could run it in the backend, and serve up the x and y coordinates with the radius in a compact binary string. The results are the npcirclepack library. It is useful for me, but maybe not anyone else.